
Note: This article focuses on soil health and fertility testing—pH, organic matter, nutrient levels, and related properties. Testing for lead or other contaminants requires different methods and is not covered here. To learn more about lead testing in Milwaukee area soils, please visit the City of Milwaukee Health Department soil screening website.
Soil testing is an easy way for farmers to turn “I think” into “I know.” It replaces guesswork with clear information about soil health and fertility—knowledge you can use to make informed decisions about amendments, crop selection, fertilizers, and long-term management.
Wondering how to test garden or farm soil in Milwaukee? UW Extension offers excellent research-based guidance on soil testing. While many of these materials have been written to meet the scales and needs of larger farms, the core soil science principles apply just as well to small urban farms and community gardens. Here’s how the Milwaukee Urban Demonstration Farm Network apply UW Extension’s soil testing guidance in four straightforward steps.
Step 1: Identify Soil Testing Goals
Before we collected samples, we needed to decide what we wanted to learn. Soil tests can answer many different questions, and being clear about our goals helped us decide where and how to sample and which analyses to request.
For the Milwaukee Urban Demonstration Farm Network (MUD), soil testing serves four main learning goals:
Understand Variability Across Beds
Urban farms often grow in constructed soils, blends of compost, topsoil, mulch, and other materials layered into raised beds. These mixes rarely behave like native soils and are often far from uniform. Two beds side by side can differ dramatically: one may hold water and nutrients well, while another may have very little organic matter, drying out and losing nutrients more quickly. Soil testing reveals these differences so management strategies can be tailored to each bed’s unique needs.
Establish Baseline Nutrient Data
A nutrient test provides a snapshot of current fertility by measuring levels of macro-, secondary-, and micronutrients, guiding effective nutrient management and preventing costly mistakes. For example, it can stop a grower from adding additional phosphorus to soils already rich from years of compost applications—a situation where additional phosphorus would increase costs without benefiting crops and could increase the risk of nutrient runoff.
Create Conservation Benchmarks
When implementing soil health or conservation practices—like cover cropping, mulching, or reduced tillage—baseline soil data provides a starting point for comparison. Tracking changes in pH, organic matter, and nutrient levels over time shows how these practices are improving soil structure, water-holding capacity, and nutrient retention.
Track Nutrient Management
Soil testing is also a way to monitor the success of a nutrient management plan. If initial tests showed a deficiency, retesting after implementation reveals how well that strategy is working. Tracking progress over time helps effectively adjust inputs, avoid overcorrection, and build a healthier, more balanced soil system season after season.
In addition to our four learning goals, an overarching objective was to collect samples that accurately represented the beds or fields we were testing—not just samples from the easiest spot to dig or the area that looked best. Representative sampling will help us get a broad sense of the fields where we are working. Knowing more about our fields helps avoid unnecessary inputs while thoughtfully amending fields with needed plant nutrients. This will ultimately improve crop health, save money, and reduce the risk of nutrient runoff.
Step 2: Establish a Soil Sampling Strategy
After outlining our goals, we developed our sampling strategy. This involved two decisions:
Step 2.1: Decide Where to Sample
We started by determining which fields, beds, or cropping areas to include in our soil testing. Our goals guided this decision, along with practical factors like our budget and whether we had noticed persistent problems in specific areas. We decided to:
1. Group Similar Areas
Where possible, we grouped beds or fields with similar characteristics—such as soil mix, construction year, amendment history, and management practices into a composite sample—a single, homogenized sample that represents the average nutrient levels or characteristics of a specific area. This approach allowed us to gather meaningful data across many beds without testing each one individually, saving both time and money while still capturing important data for management decisions.
2. Target Specific Areas
In addition to grouped composites, we also collected composite samples from smaller specific areas that required closer attention. These included newly constructed beds, beds with unique soil mixes, areas growing high-value crops, or beds where there were recurring crop health issues. Choosing just a few areas to sample separately allowed us to focus testing resources where soil data would most directly inform management changes.
Step 2.2: Decide Which Analyses to Order
Each lab analysis measures a specific aspect of soil fertility or health, but no single test answers every question. We selected analyses that work together to explain how nutrients behave in our urban soils. Broadly, these tests help us understand four things:
Nutrient Availability
Levels of macro-, secondary-, and micronutrients indicate whether essential nutrients are deficient, adequate, or excessive for crop growth.
Our analyses included: phosphorus, potassium, calcium, magnesium, sulfur, boron, manganese, zinc, and copper.*
Nutrient Balance and Retention
Measures like pH, cation exchange capacity (CEC), and base saturation help explain how well soils hold nutrients, how balanced those nutrients are, and whether chemical conditions may limit nutrient uptake—even when nutrient levels test high.
Our analyses included: soil pH, buffer pH, cation exchange capacity (CEC), and base saturation.
Soil Structure and Biology
Organic matter, texture, and related physical properties influence water-holding capacity, root growth, microbial activity, and long-term soil resilience.
Our analyses included: organic matter, soil texture, and bulk density.
Salt Accumulation Risk
Soluble salts help identify when repeated compost, fertilizer, irrigation water, or environmental inputs may be creating conditions that limit water uptake and stress crops.
Our analyses included: soluble salts / electrical conductivity (EC).

*Nitrogen is important! Why didn’t we test for it?
On the recommendation of our colleagues in the UW-Madison Department of Soil Science, we’re using organic matter to estimate nitrogen availability instead of running inorganic nitrogen tests.
Forms of nitrogen like nitrate and ammonium change quickly during the growing season, so a single test only reflects conditions in the moment the soil test was taken and isn’t very helpful for long-term planning. Most of the nitrogen plants use is released slowly as organic matter breaks down over time. Measuring organic matter is a practical, affordable way to understand how much nitrogen soil can supply throughout the growing season.
While we’ll use the same decision-making process each year, the way we group beds or the tests we order may change. In constructed urban soils—where frequent amendments can shift nutrients, pH, organic matter, and salts more rapidly than in native soils—many chemical properties need yearly monitoring. Some physical properties that change slowly, such as soil texture or bulk density, can be tested less frequently.
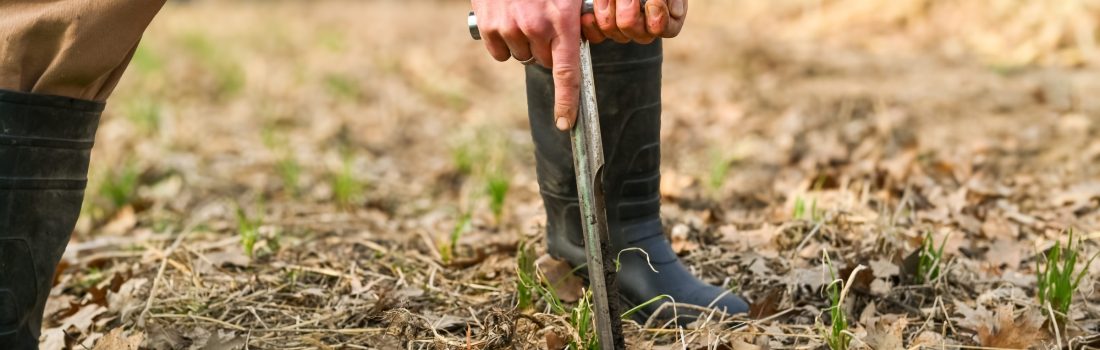
Step 3: Collect and Submit Soil Samples
With our strategy in place, we were ready to collect our samples. We were careful to collect samples when the soil was not frozen, was relatively undisturbed, and moisture conditions were moderate. It’s best to avoid sampling immediately after fertilizing or heavy rain, as this can skew nutrient readings. While soil samples can be taken at any time of year, two of the most strategic times are:
- Early Spring: As soon as the soil has thawed and is workable, ideally before planting begins. This ensures results arrive in time to shape a soil amendment plan for the season.
- Late Fall: Following harvest, when fields and beds are stable and easier to access. This provides nutrient data early enough to plan lime or fertilizer applications during the winter.
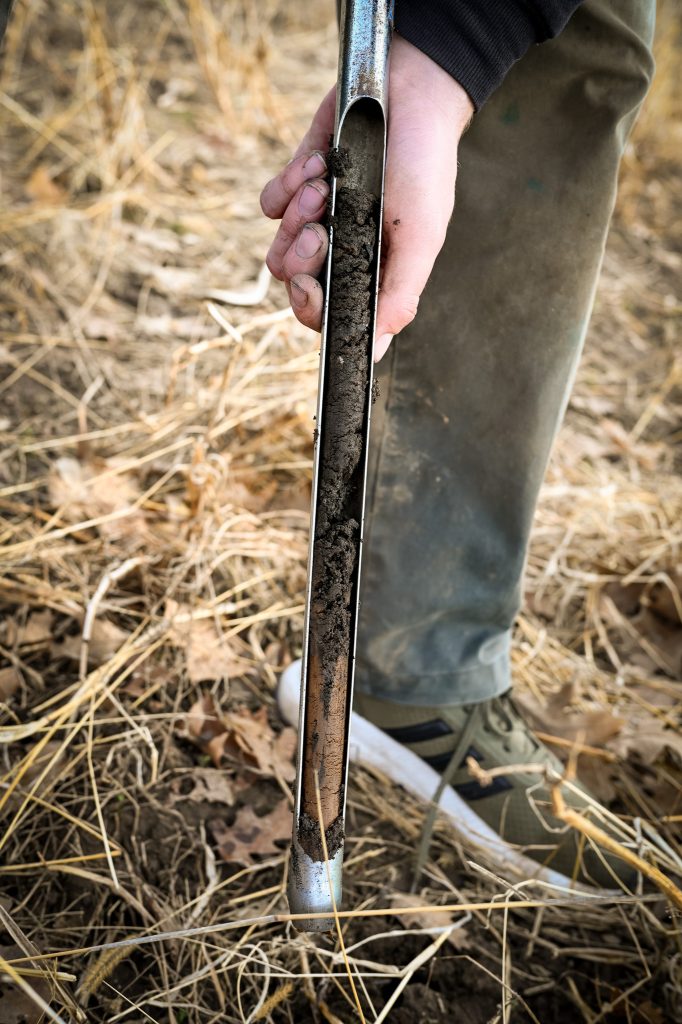
Before we began collecting samples, we marked our soil probe at eight inches with permanent marker to ensure every core was taken at a consistent depth. This depth represents the main cultivated soil layer where roots grow and nutrients are most actively used, making it ideal for comparing nutrient levels and compaction across sites. If soil cores are taken too shallow or too deep, you can skew soil test values and the resulting fertilizer guidelines.
For each composite sample, we followed a W-shaped path across the area being sampled and randomly selected 10-20 spots along that path to collect soil cores.
We recorded the GPS coordinates of each sampling point so we can test the same locations in the future and make accurate comparisons over time. In raised beds, we collected cores from multiple random points within each bed.
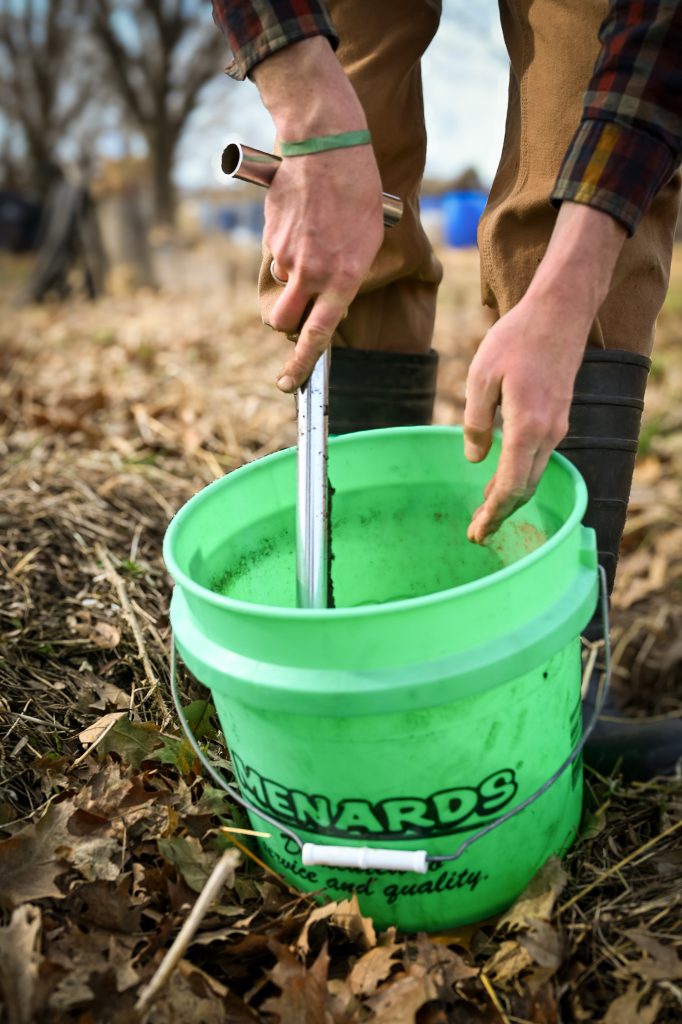
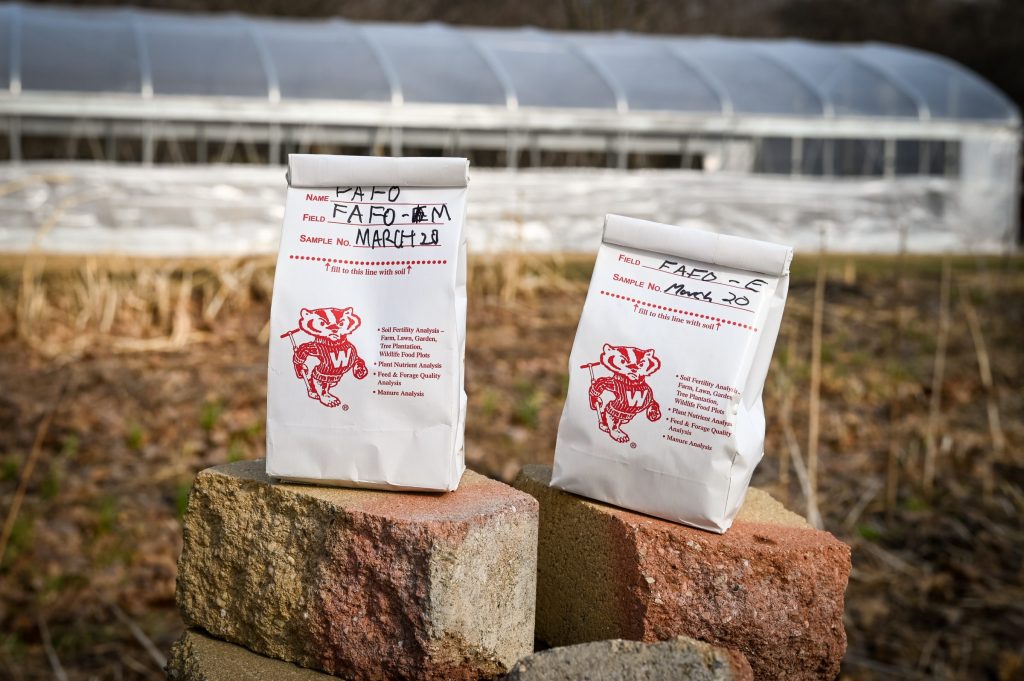
We added the soil to a five-gallon bucket, collecting cores until we had about two cups—this is the amount most labs request for each sample. We made sure to remove visible plant material like leaves or roots from the sample, mixed the cores gently, then dumped the soil into a soil sampling bag labeled with the farm name, a unique sample ID, and the sampling depth.
Our sample IDs were short, consistent, and combined a farm or site code with a simple number (e.g., KF-01, KF-02, etc. were used for Kinship Farm). We’ll use the same IDs for the same locations in the future so that results can be clearly traced and compared over time.

No Probe? No Problem!
You don’t need a soil probe to test your soils; you can collect accurate soil samples using everyday tools. Both University of Vermont Extension and Cornell Extension offer step-by-step guides for sampling with a shovel or trowel.
Where to Get Soil Sampling Bags
Soil sampling bags can be obtained directly from soil testing laboratories, ordered online from agricultural suppliers, or purchased at garden centers that serve landscapers or commercial growers. Plain brown lunch bags, zip-top bags, or sturdy paper envelopes can also be used, as long as soils are dry and bags are clearly labeled.
Where to Send Soil Samples
When choosing a lab, it’s important to select one that is Wisconsin Department of Agriculture, Trade, and Consumer Protection (WDATCP) certified to ensure accuracy and reliability. For Milwaukee-area growers, two good options are the UW Soil & Forage Analysis Lab in Madison, WI and Rock River Laboratory in Watertown, WI.
Submitting a soil sample involves more than sending soil alone. Labs rely on additional background information to interpret results correctly and provide recommendations that match site conditions and production goals. Most labs will ask you to fill out a form for each sample, listing the following information:
- Sample ID: Use the same ID listed on your soil sample bag.
- Soil Type: Indicate whether the soil is sandy, loamy, clay-based, or a constructed mix (common on urban farms). Soil type affects nutrient retention, water-holding capacity, and pH buffering, all of which influence how recommendations are calculated.*
- Future Crop Rotations: Different crops use nutrients at different rates, so labs use crop information to tailor fertilizer and soil amendment recommendations.
- Yield Goals: If you have a target yield for the crops you plan to grow (e.g., pounds per acre), include it. Labs use this to calculate nutrient requirements for optimal production.
- Previous Legume Crop: Indicate if legumes (like beans or peas) were grown there previously. Legumes fix nitrogen, which can reduce the need for additional nitrogen fertilizer.
- Plow Depth: If you till or plow your beds, indicate the average depth on the sampled fields.
*What if I don’t know my soil type?
You can find your soil type using the USDA Web Soil Survey. University of Connecticut Extension has a great video showing you how to use this tool. However, many urban soils aren’t fully mapped in WSS, and USDA is still working to expand coverage in cities.
If Web Soil Survey data isn’t available for your site, you can order a soil texture analysis from the lab. This test identifies the proportions of sand, silt, and clay in your sample and assigns a standard soil textural class.
If you’re growing in a “raised bed mix” or in-ground beds with heavy, ongoing compost additions, a texture analysis is often unnecessary. These soils don’t behave like native mineral soils, so texture results can be misleading. In these cases, it’s usually best to list the soil type as a “constructed mix”.
How to Mail Soil Samples
Most labs will accept drop-offs, but you can also send your soil samples in the mail. Before mailing, make sure soil samples are properly dried and packaged to prevent mold, odor, or changes in nutrient levels during transit. Spread soil thinly on a clean surface (such as a tray, paper plate, or newspaper) and allow it to air-dry at room temperature. Do not oven-dry or apply heat, as this can alter test results. Once fully dry, mix the soil thoroughly and place it into your soil sample bag.
Pack your completed forms inside a separate plastic bag to protect them from moisture. Place samples and paperwork in a sturdy box or padded mailer.
Standard ground or priority mail is sufficient—soil does not need refrigeration or special handling. If asked by the mail carrier, you can describe the contents as “non-hazardous soil samples for agricultural testing.” Avoid mailing samples late in the week or close to holidays because delays could cause moisture buildup or delay processing.
Step 4: Interpret Your Soil Test Results
Soil test results are returned as a written report from the laboratory. This report combines test results with short explanations and fertilizer or amendment recommendations based on University of Wisconsin research and the information submitted with the samples.
Most soil test reports include two main parts designed to answer the basic questions: What does the soil already have? and What, if anything, needs to be added?
- Measured results: This section lists the soil properties and nutrients that were tested, such as pH, organic matter, and nutrient levels. Results are shown as numbers and are often grouped into categories like low, optimum, or high.
- Nutrient and soil amendment recommendations: Based on the test results, crop information, and production goals provided at submission, the report usually includes suggested application rates for nutrients or lime. These recommendations are meant to guide planning and help avoid unnecessary or excessive inputs.
Here are two great videos that can help you learn more about taking soil samples and interpreting your soil test results:
How Often Should You Test Your Soil?
As part of our agreement with USDA–NRCS, the MUD Farm Network tests soil at each MUD farm every spring and fall. This schedule allows the team to thoroughly track changes over time and evaluate how management practices are affecting soil conditions across sites.
While soil properties and nutrient levels can absolutely change over the winter and continue to change throughout the growing season, testing this frequently is not necessary for most farms or gardens. For many growers, soil testing every two to three years provides enough information to guide nutrient management decisions, especially when management practices and crop plans remain consistent.

Want to dig deeper into soil testing and nutrient management?
The Nutrient Application Guidelines for Field, Vegetable, and Fruit Crops in Wisconsin (A2809) is the foundation for everything we’re sharing here. While this post explains how we applied A2809’s guidance to the unique conditions of urban farms and gardens in Milwaukee, A2809 remains the go-to resource for conducting soil tests, interpreting results, and planning nutrient applications. It provides clear recommendations, target ranges, and practical tables that can help you turn lab numbers into actionable decisions.